Be aware of wrong use! ;-)
Be aware of wrong use! ;-)
This site provides easy way to render specially styled OpenStreetMap maps, for surveying the area. We call it detail survey print, where all objects are rendered.
The map you can view on this site is not the same as that will go to your print! You are seeing default OpenStreetMap display, but for print you will get your own very detailed map.
Make sure to select a reasonable area and divide to the necessary number of pages, based on area's density. Otherwise you will just get overlapping trash.
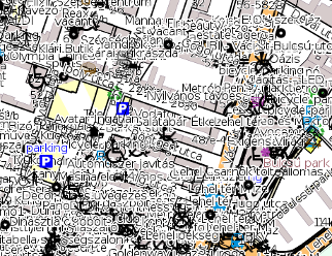
This part of Madrid is rendered for shop POI survey.

render(myMap) in use
Printed housenumbers map loaded in JOSM via mapwarper.net
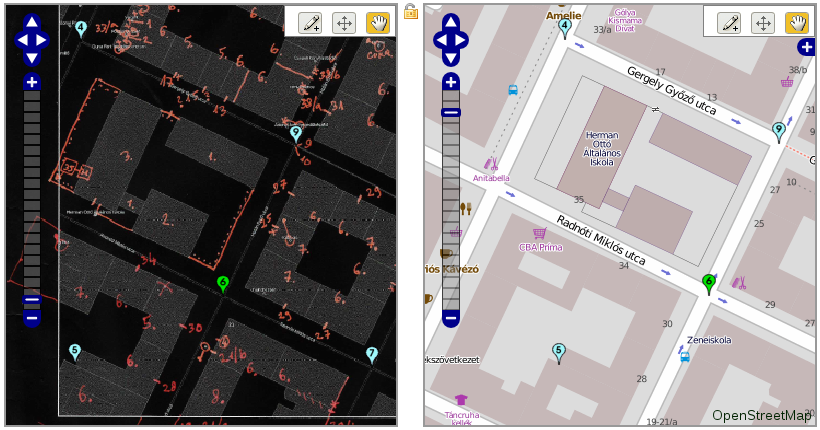
mapwarper in use
You can mark identical points on both OSM and your scanned paper, then use in JOSM as a layer.
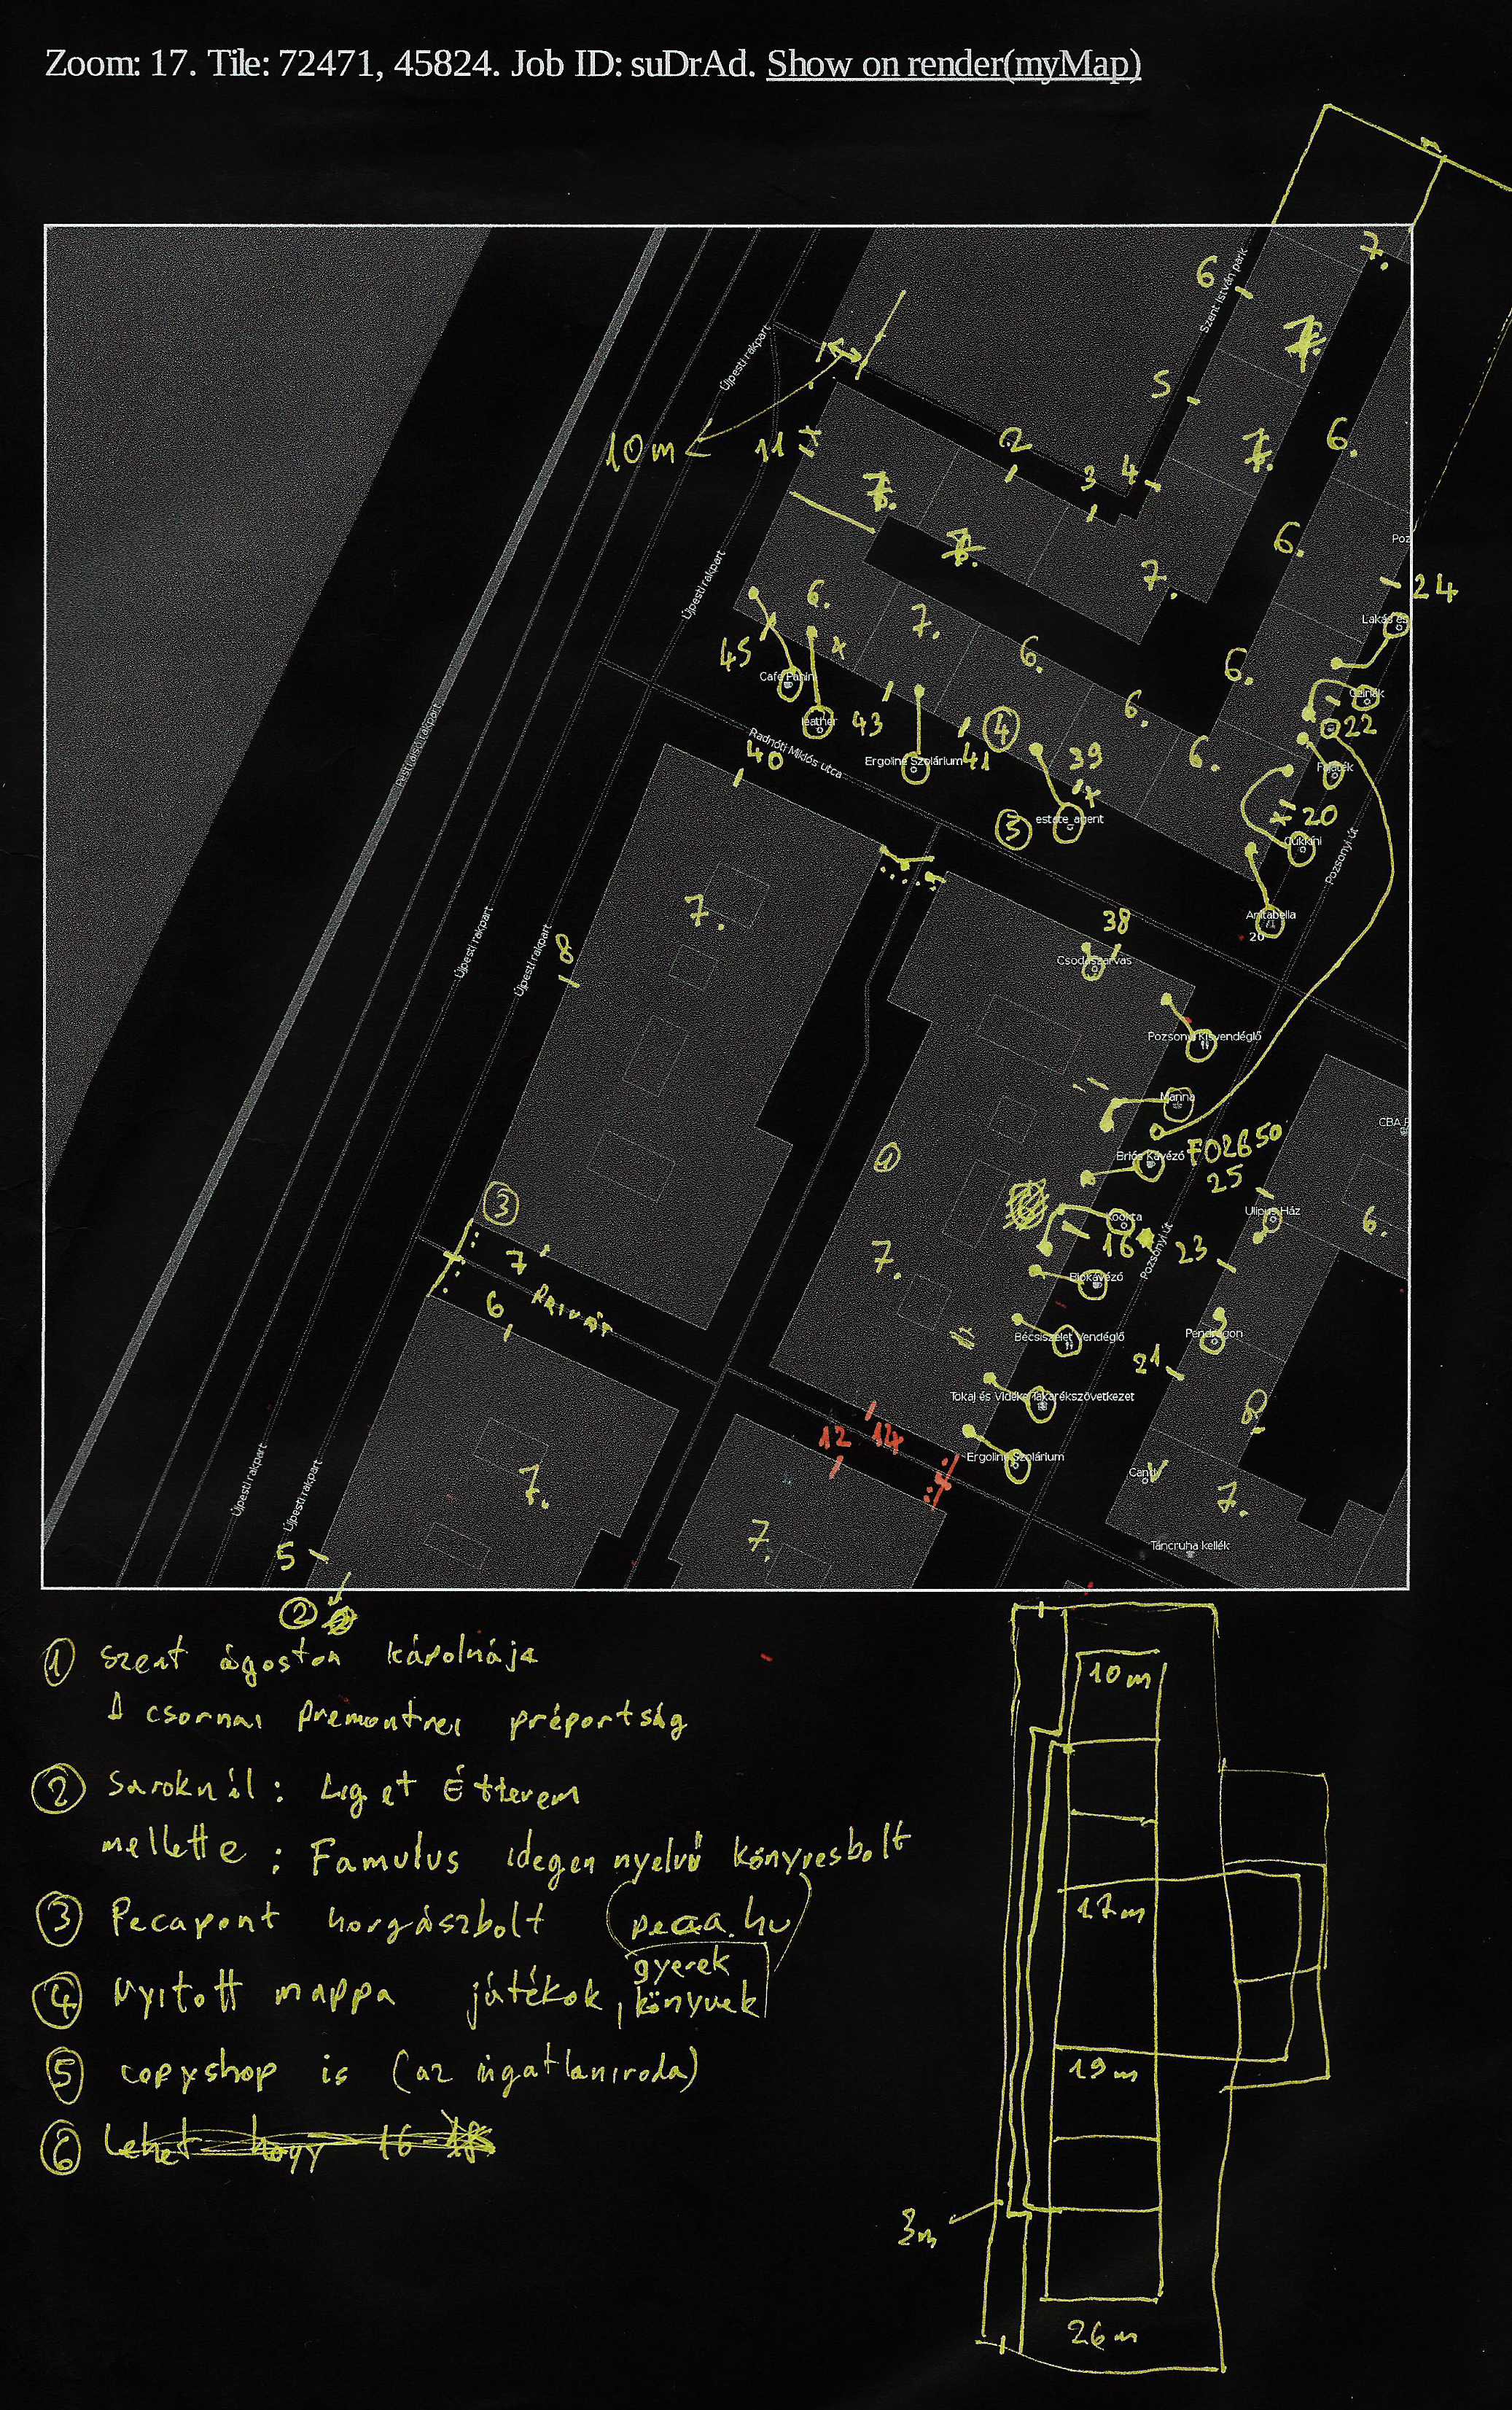
scanned map example
Shop moving, house numbers, entrance, and building levels are also noted on this example.
I am sure you'll develop your method, but here are some ideas.
| XI | on house line: X is the middle, I is the entrance, when near to middle this makes unambiguous |
|---|---|
| I | on house line: near middle: entrace IS in the middle. Other place: entrance is there |
| O | • | move object |
| X | not on house line: there is something, not mapped, but should fit, e.g. a shop |
| 12 | a note below |
| 6. | building levels |
| 6 | housenumber |
| \_/ | on house line: there is something on the roof that can help positioning the entrance (Bing) |
To navigate, you can paste an OSM Permalink or city search or mouse. You can also jump back to OSM for furhter search by the Open on OSM link.
Select what to render: Press Draw box and draw a box on the screen. When finsihed, you must click the box to activate for modifying. You can select maximum 18 square kilometers.
You can store your selection by using the Permalink link and then bookmark it. This link is also added to the output files, so you can return to the same selection.
You can choose to divide to maximum 9 pages. Select which style you want to use, shops, housenumbers. See below for more info. The papers size selection sets the image's width in CSS. The aspect ratio is up to you to select correctly. We didn't put a limitation on this because you way want to print something else, for example squares and leave empty space for notes.
Pass your selected area to the renderer by the button. Then wait a little before you click the JOB ID link. You can also store your JOB ID and use it in the Download result box later (I don't yet know how long will I keep them).
Rendering usually takes 1-2 minutes. Output are 300 DPI PNG files for printing.
For now this is for paper based survey. The overview HTML contais the necessary CSS 3 codes for nice printout (decend browser required).
Now you can use the paper as you wish, but here is how I do.
Do your survey, take notes on the paper. Scan the results, invert avoid white paper backround in JOSM, convert to JPG for smaller size (it does not break the quailty, it's bad already).
Upload the file to MapWarper if you want to view it in background of JOSM. This method really rocks. Rectify the map there by marking identical points on your paper and OSM, e.g. junctions, house corners. Then in the export tab, copy the JOSM link.
In JOSM, use the Imagery menu -> Rectifed Image -> Custom WMS link, paste the link there. When you zoom, you may need to use the right-click on the imagery layer and choose Change resolution, that will update the scanned paper to higher resolution.
The various rendering styles basically display the same map. The main difference is the choice between colliding properties and their level of detail. For example, "shops" style displays the POI's icon, "housenumbers" style shows the housenumber instead, if both are known.
The Detail selection specifies how much info to print. In full detail mode to this, your map may get a lot of overlapping text, so make sure to print enough small area on enough papers for dense areas.
Detail levels activate several "draw all" features in the output. So unless you are printing a complete smaller town, "Full detail" is recommended.

This render contains all nodes and ways that are:
(Multipoly is under progress.) If you have more ideas to render, let me know.
This renders everything with housenumber: addr: nodes, buildings, addr:interpolation ways, etc.
This output overrides icons if the object has a wheelchair "yes", "no" or "limited" value.
Toggle a checkbox to compare.